By Jeffrey M. Haynes RRT RPFT FAARC
In many patients the central question that prompts an order for a PFT is whether or not the patient’s lung function is normal or abnormal.
It is important to keep in mind that normal function or PFT data does not always accompany normal lungs. For example, there is an emphysema phenotype (subgroup) known as non-obstructive emphysema.
Patients with non-obstructive emphysema show disease on a CT scan, low diffusion capacity, but have normal spirometry.
Lutchmedial et al [1] found that 10% of patients with CT scan evidence of emphysema had normal spirometry.
Moreover, chronic diseases like emphysema develop slowly over time, so affected individuals slowly descend out of the normal range before they have values that we define as abnormal. [2]
Reference or “Predicted” Equations
Patient data is declared “normal” or “abnormal” when compared to a reference or “predicted” equation.
Reference equations for PFT data are generated by testing a large number of non-smoking individuals without lung disease.
Unlike other laboratory tests (e.g. blood glucose), normal pulmonary function are affected by age, sex, race, and height.
For example, a blood glucose value of 85 mg/dL is normal for a 10-year-old boy and his 40-year-old father, where a forced vital capacity of 3.5 L is normal for the boy but quite abnormal for his father.
For this reason, PFT reference equations need to include subjects of different ages, sexes, races, and heights.
Unfortunately, many commonly used reference equations use inadequate numbers of subjects and may be affected by the devices used to make the measurements.
Moreover, in many reference equations groups such as the elderly and racial minorities are under-represented.
For example, one of the most commonly used spirometry reference equations is NHANES III. However, NHANES III does not contain data on the very young or the very old, nor does it contain data from Asian subjects.
Therefore, comparing PFT data from an 82-year-old male from Vietnam to normal individuals in NHANES III is a false comparison because NHANES III does not include any data from 82-year-old males from Vietnam.
Kim et al showed that applying the NHANES III FEV1 equation to Asians misclassified 30% of never smokers when compared to an ethnically-specific equation. [3]
Many clinicians mistakenly believe that changing the race on the demographic screen to “Asian” changes the predicted value; however, in most circumstances the patients are still compared to white subjects.
In my opinion, the best reference equations for spirometry is the Global Lungs Initiative (GLI) equation published by Quanjer et al in 2012. [4]
The GLI equations includes data from over 74,000 subjects ages 3-95 years from 33 countries. In addition, the GLI equations include data from several ethnic groups including African Americans, Southeast Asians, and Northern Asians.
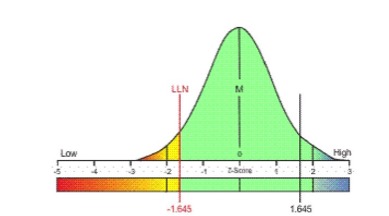
Once the data is collected, the range of normal values can be expressed in a bell curve (figure 1.).
The center of the curve represents the average (mean) or median value.
The mean or median value is commonly referred to as the “predicted” value.
If a value is half of the predicted value, it would be classified as 50% of predicted.

Figure 1. Bell curve showing the distribution of a pulmonary function value from normal individuals. M = mean or median; LLN = lower limit of normal.
80% of Predicted is Not the Lower Limit of Normal
A common and incorrect practice is to classify data that is ≥ 80% of predicted as normal and data that is < 80% of predicted as abnormal.
In 1979, Sobol and Sobol wrote that “nowhere else in medicine is such a naïve view taken of the lower limit of normal.” [5]
If the 80% of predicted rule were correct, the lower limit of normal for arterial oxyhemoglobin saturation would be 76% (95% as the mean of normality). [6]
References
[1] Lutchmedial SM, Creed WG, Moore AJ, Walsh RR, Gentchos GE, Kaminsky DA. How common is airflow limitation in patients with emphysema on CT scan of the chest? Chest 2015;148(1):176-184.
[2] Harvey BG, Strulovici-Barel Y, Kaner RJ, Sanders A, Vincent TL. Mezey JG, Crystal RG. Risk of COPD with obstruction in active smokers with normal spirometry and reduced diffusion capacity.
[3] Kim N Kim SY, Song Y, Suh C, Kim KH, Kim JH, et al. The effect of applying ethnicity-specific spirometric reference equations to Asian migrant workers in Korea. Ann Occup Enviorn Med 2015;27:14.
[4] Quanjer PH, Stanojevic S, Cole TJ, Baur X, Hall GL, Culver BH, et al. Multi-ethnic reference values for spirometry for the 3-95-yr range: the global lung function 2012 equations. Eur Respir J. 2012;40(6):1324-1343.
[5] Sobol BJ, Sobol PG. Per cent of predicted as the limit of normal in pulmonary function testing: a statistically valid approach (editorial). Thorax. 1979;34(1):1-3.
[6] Rubin BK, Haynes JM. Myths, misunderstandings, and dogma in respiratory care. Respir Care 2012;57(8):1314-1324.
